Overview
Safe Agricultural Products and Water Graph (SAWGraph): An Open Knowledge Network to Monitor and Trace PFAS and Other Contaminants in the Nation's Food and Water Systems A ProtoOKN project
The goal of SAWGraph is to connect federal and other datasets to more quickly analyze data and make decisions around per- and polyfluoroalkyl substances (PFAS) sources, testing, impacts, and risks. The graph integrates data and provides interfaces that support:
- analysis, mapping and communication of the results of testing for PFAS contamination
- spatial connections to known and potential sources
to support PFAS research and decision making around PFAS testing and mitigation.
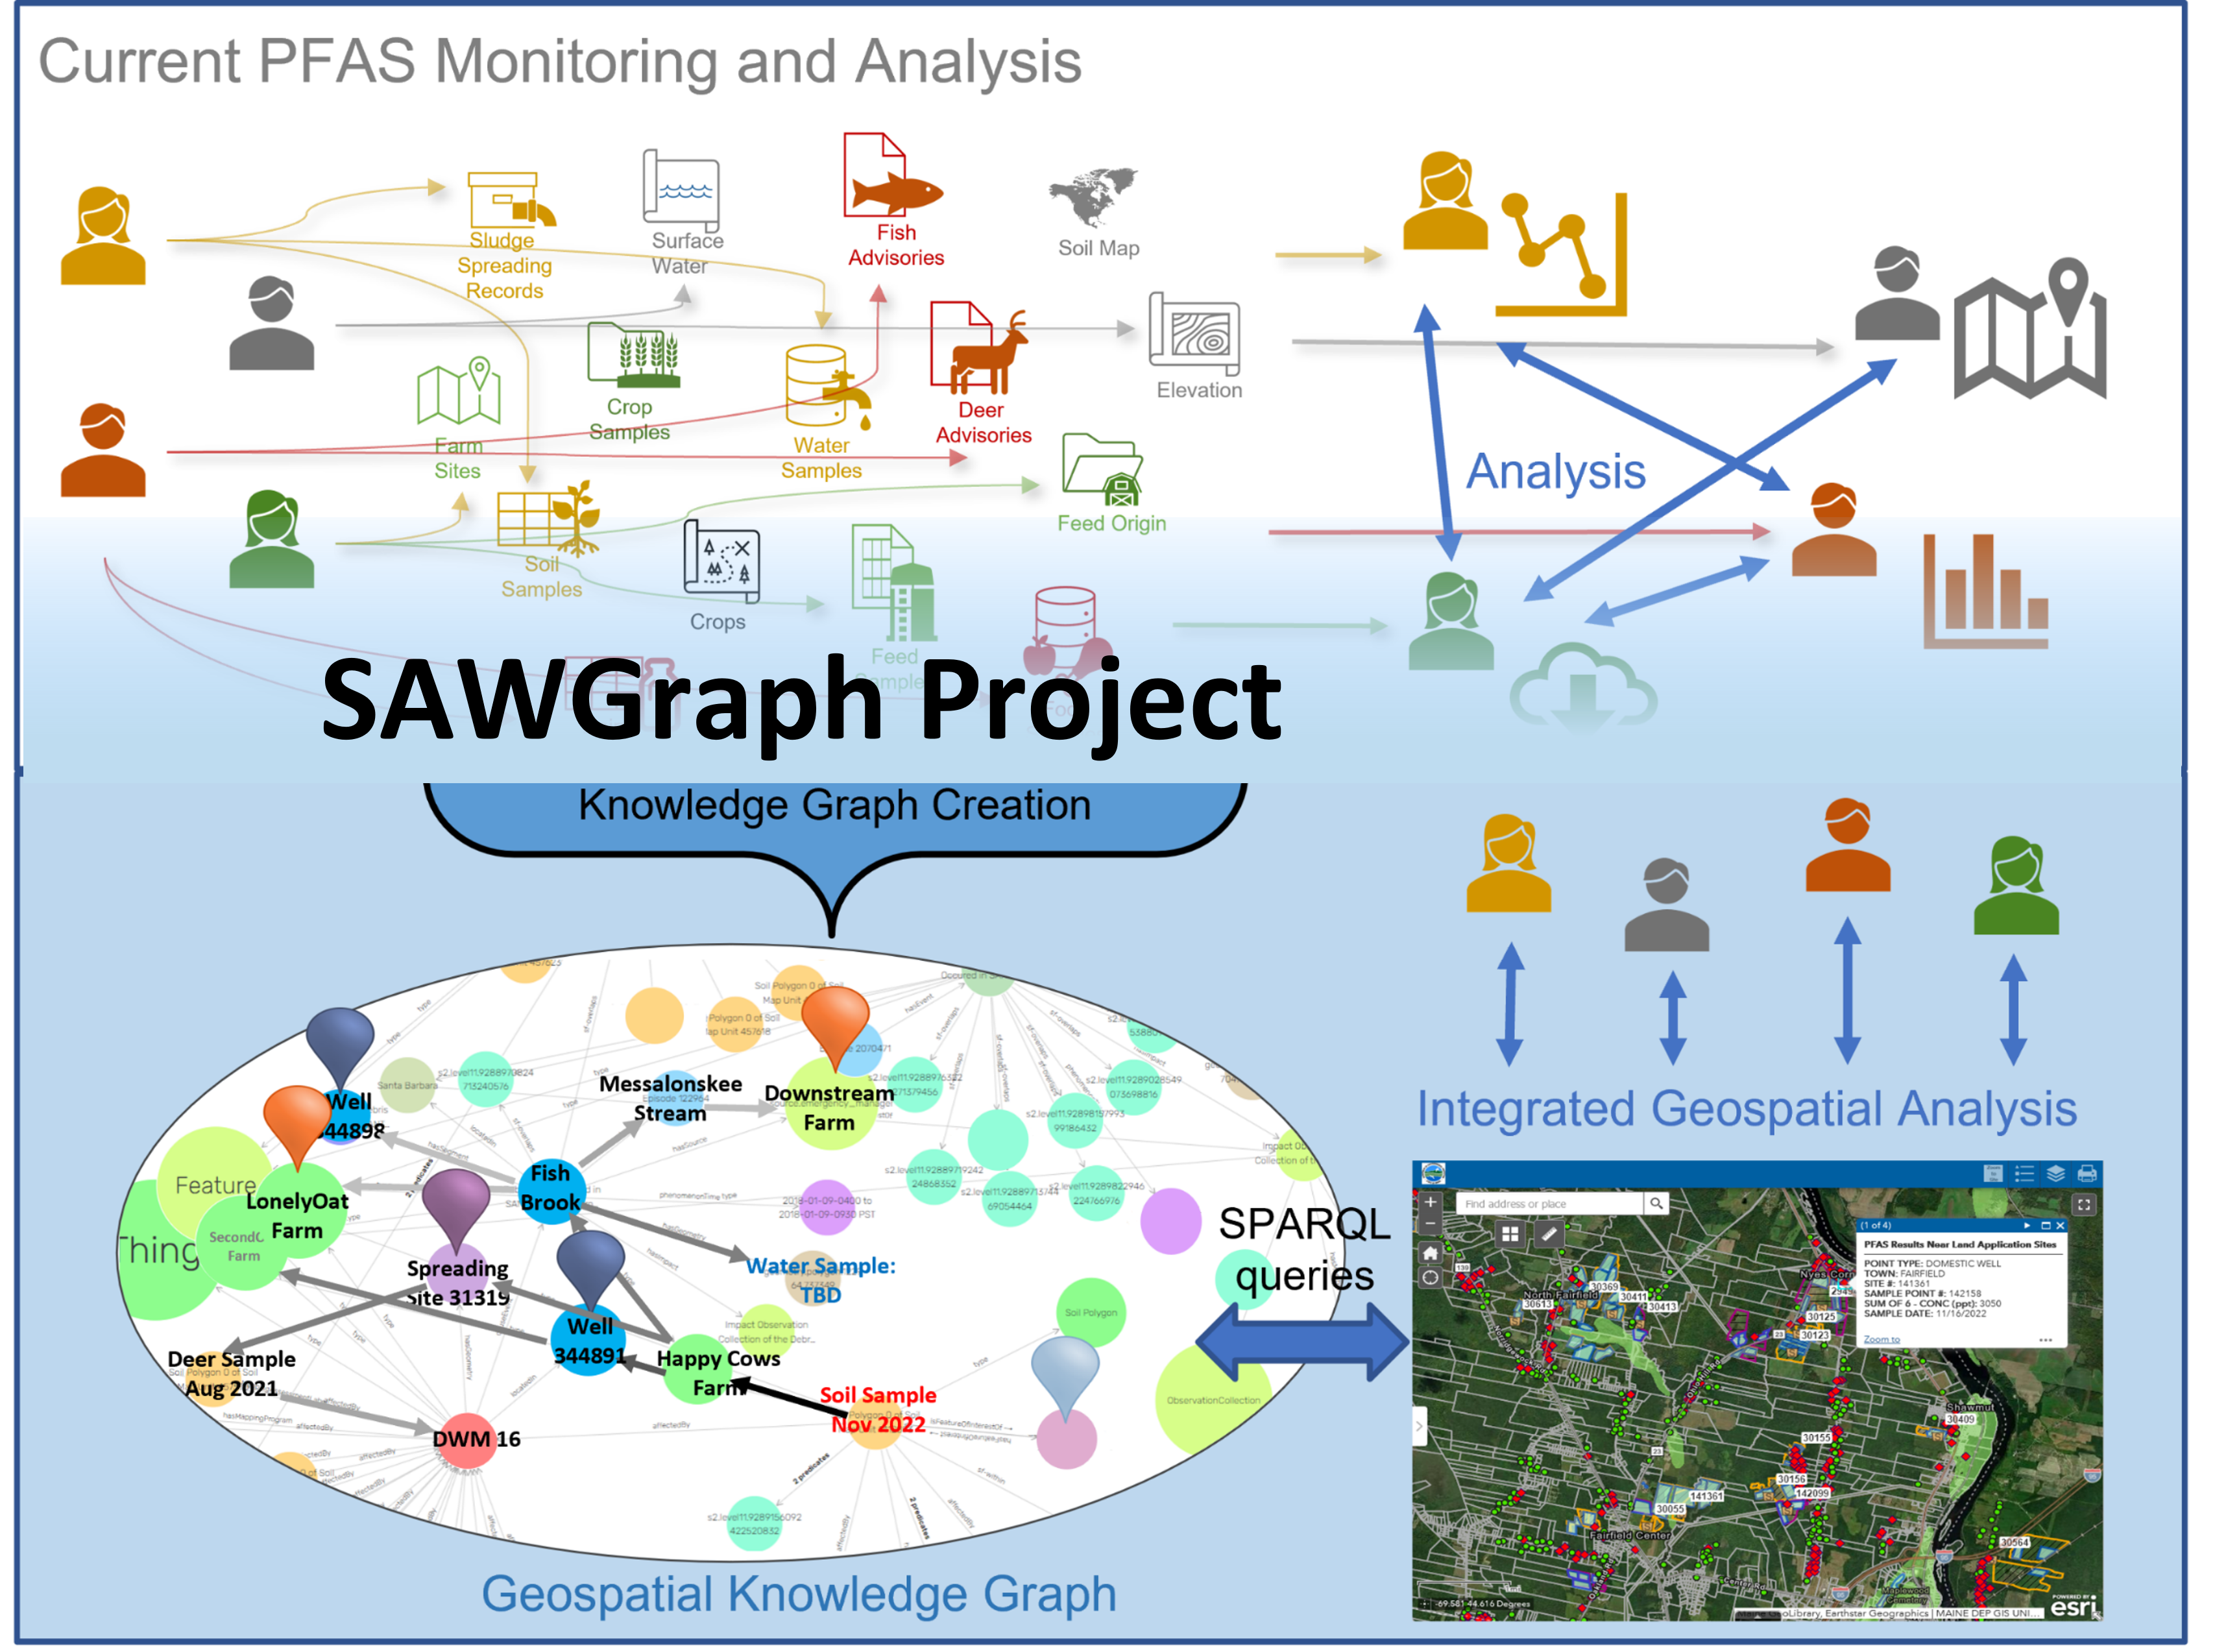
In contrast to the current ecosystem of disconnected datasources, SAWGraph works by integrating and aligning data into a geospatial knowledge graph that supports interfaces that can dynamically answer questions about the related datasets.
Intended Users
The primary end users of SAWGraphs are personnel at state and federal agencies who monitor the environment and the safety of drinking water and agricultural land and products. End users include but are not limited to:
- personnel at EPA and state environmental protection agencies (e.g. state environmental toxicologists)
- personnel at USDA and state agricultural agencies.
- experts from FDA, USGS and similar state agencies.
- drinking water monitoring
- understanding the extent and sources of environmental contamination with PFAS
- PFAS researchers
- environmental justice
- formulate and implement comprehensive test plans aimed at monitoring elevated PFAS levels in drinking water or agricultural lands,
- pinpoint the most significant sources of PFAS in a state and how it impacts disadvantaged communities;
- identify populations at elevated risk and prioritize testing resources and support accordingly;
Use Cases
🔍 Understanding Testing Gaps
Where have we tested and where are significant gaps?
- Where have we tested for what?
- What waterbodies are near potential contamination sources? See Example
- What do the available test results show in a particular region?
- Where are the biggest testing gaps based on what is known?
⚠️ Assess and Map Risks
Who is impacted the most?
- Where are concerning test results suggesting prioritized investigation? See Example
- Which communities are at greatest risk?
🔄 Trace Contamination
Where does PFAS end up? Where does it originate?
- How do point sources (facilities, landfills, training sites) affect surroundings?
- What potential sources are upstream from concerning test results?
- What do downstream test results show? See Example
- Which wells need prioritized testing?
🔬 Research Insights
What linkages does the data suggest?
- Where are unexplained high test results?
- What agricultural practices reduce PFAS exposure?
- What connections exist between different PFAS substances?
Competency questions and User queries
- Testing Coverage and Gaps: Where (locations/towns) should we prioritize environmental/water testing?
- E.g. which wells are within 5 miles of landfills/airports/biosludge application sites? Which wells near locations with a reported PFOA contamination above 4ppt have not been tested?
- Assessing Contamination Impacts: Where and who is impacted? (Prevalence, risk/vulnerability mapping)
- E.g. Which towns or counties have multiple test results with PFOS levels above 20ppt with no known contamination source nearby? Which chemicals show the highest average readings in samples from a particular region? Which towns/counties are most vulnerability based on their proximity to known or potential PFAS sources?
- Contaminant Tracing: What are potential sources of contamination at a particular location or area?
- E.g. What potential contamination sources exist 20 miles upstream from the sample result? What wells are hydrologically connected to other wells with a reported contamination of +10ppt